MySQL Debugging Stored Procedures and Functions
The stored procedure debugger provides facilities for setting breakpoints, stepping into individual statements , evaluating breakpoints and many other tasks.
Do you have similar website/ Product?
Show in this page just for only
$2 (for a month)
0/60
0/180
The debugger make changes to temporarily add instrumentation code to the stored routines that you debug. 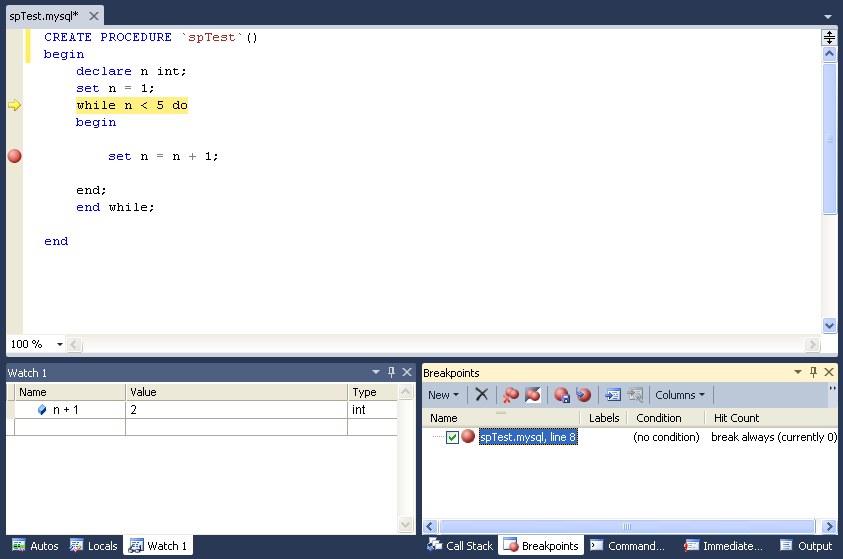
You need to ALTER ROUTINE privilege for each stored procedure, function, or trigger that you debug.
To start the Debugger Follow these steps:
1.First of all choose a connection in the Visual Studio Server Explorer.
2.Then expand the Stored Procedures folder. note that stored procedures can be only debugged directly. To debug a user-defined function, create a stored procedure that calls the function.
3. Click on a stored procedure node
4.Right click and from the context menu choose Debug Routine.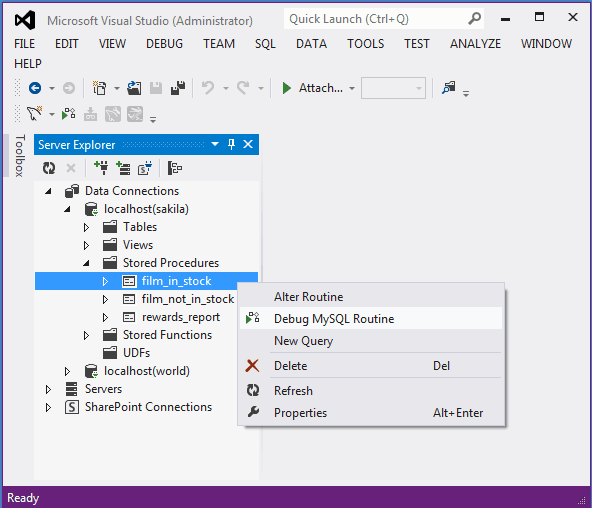 5.Now Visual Studio will switches to debug mode, opening the source code of the routine being debugged in step mode, positioned on the first statement.
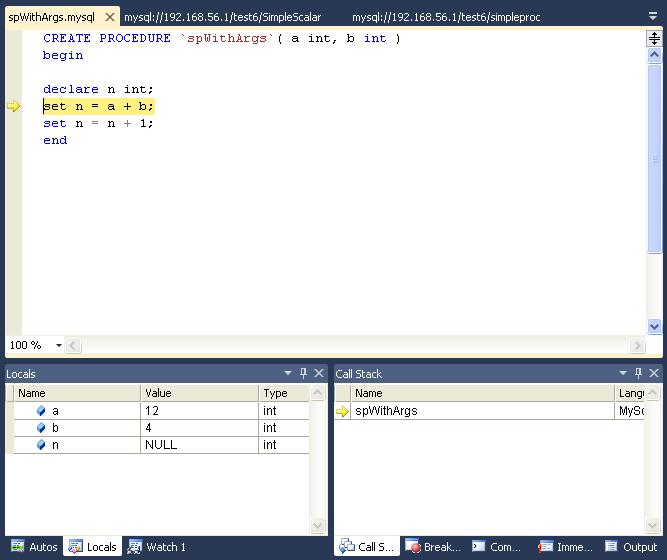
6.Set up all the argument values then press OK to start the debug session or Cancel to cancel the debug session.
Debugger Functions
The debug versions of the routines are prepared for you automatically, and when the debug session ends and the original versions of the routines are automatically restored.
Basic Debugging Operations are as follow:
1.To display the Locals tab choose the menu item Debug, Windows, Locals.
2.If the last step operation changes the value of a local then its value will be highlighted in red.
3.You can change the value of any local.
4. To open the Watch tab, choose the menu item Debug, Windows, Watch.
5.When debugging a trigger to session variables referenced then the new and old object will be listed. For example in a trigger for INSERT for a table defined as:
create table t1( id int, myname varchar( 50 ));
6. Locals will list the extra variables new.id and new.myname. For an UPDATE trigger, you will also get the extra variables old.id and old.myname. These variables from the new and old objects can be manipulated the same way as any ordinary local variable.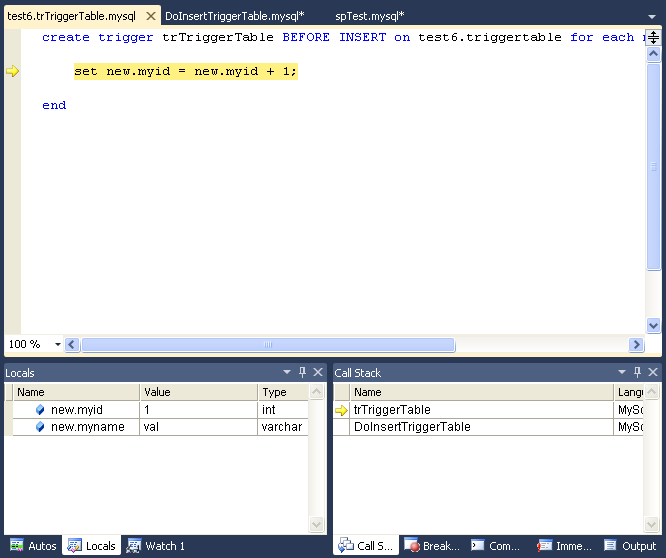
To Call Stack follows these steps:
1.To show the Call Stack tab, choose the menu item Debug, Windows, Call Stack.
2. The stack trace will list all the stack traces, one for each routine invocation. The one with a yellow mark is the current stepping point.
3.Clicking in another will activate in the editor the tab for that routine source, highlighting in green the last statement stepped.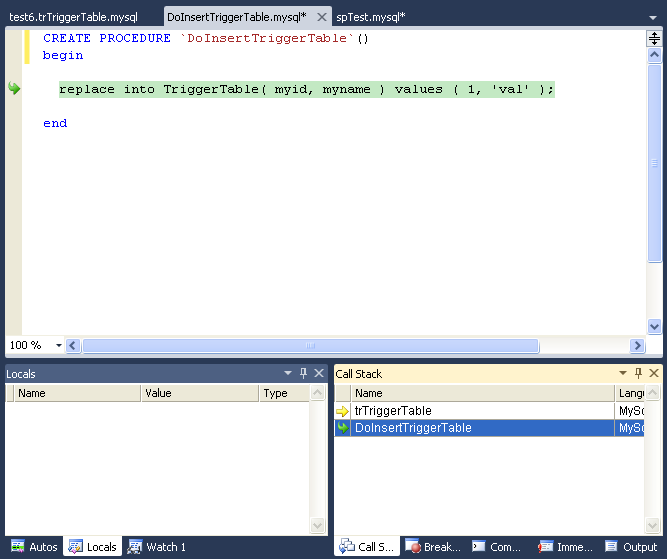 For breakpoints follow :
1.To show the Breakpoints tab choose the menu item Debug> Windows> Breakpoints.
2. The Breakpoints tab will show all the breakpoints defined. so you can enable and disable breakpoints one by one or all at once
3.Click in the left gray border of any MySQL editor.
4.Once a breakpoint is defined then it will appear enabled or disabled.
5.To define conditional breakpoints, after creating the breakpoint, right click in the red dot and choose Condition.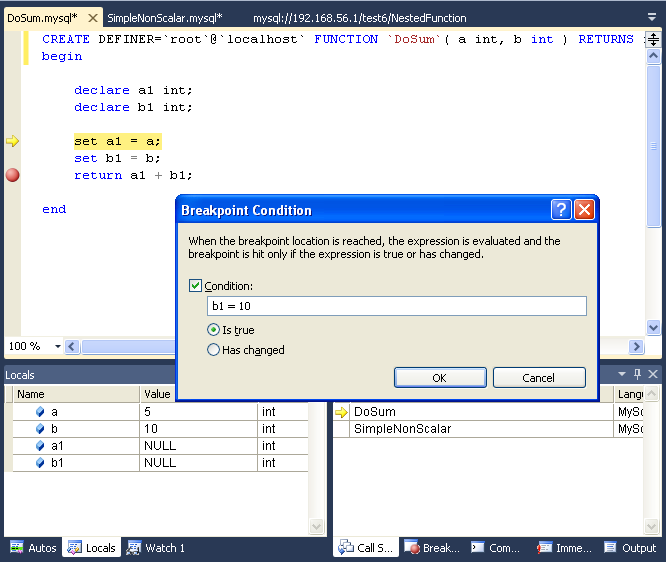
6.You can put any valid MySQL expression and state if the condition is Is True or Has changed. The former will trigger the breakpoint every time the condition is true, the latter every time the condition value has changed.
7. After creating the breakpoint, right click in the red dot and choose Hit Count to define pass count breakpoints.In the pop-up dialog, define the specific condition to set.
CONTINUE READING
MySQL Debugging
Ayesha
Tech writer at newsandstory