What is Expansion Path in Economics?
Here we understand the Concept of Expansion Path in detailed.
Do you have similar website/ Product?
Show in this page just for only
$2 (for a month)
0/60
0/180

Meaning of Expansion Path:
Expansion path shows the path on which a rational producer would prefer to increase scale of production in his firm.
For eg: Suppose if prices of labour and capital are constant, iso-cost line will move up with every increase in the monetary resources of the firm. If price of capital and labour is Rs. 5 and Rs. 10 respectively a firm can purchase at the most 20 units of capital or 10 units of labour, but with Rs. 200, it can purchase at the most 40 units of capital or 20 units of labour.
Here, iso-cost line moves up with every increase in the monetary resources of the firm. Therefore point of equilibrium will change. We can obtain a smooth line joining various points of equilibrium lying on different iso-cost lines. This line is known as expansion path of the firm. It refers the path on which a firm expands its scale of production.
Explanation of Expansion path:
Now, we will explain the expansion path of a firm with the help of iso-quant/iso-cost curves:
Expansion path is a line or a curve on which every point is an equilibrium point. All these points indicates minimum cost combinations of two factors at various levels of output. As the firm tries to expand its output, it will try to see that it attains equilibrium at the lowest cost at that output. This is the concept of minimizing cost and maximizing profit.
Suppose, here we assume that the prices of two factors are given and the map of Iso-quants means equal quantity curves is also given. Each higher iso-quant represents higher level of output. Each higher iso-cost line shows higher level of cost that is (outlay) but the prices of two variable factors that is (labour and capital) remain constant. The tangency between iso-cost and iso-quant indicates equilibrium which shifts as the firm moves from lower to higher level of production. A firm receiving maximum profit will produce at one or the other point on the expansion path, because any other point outside expansion path will mean less profit.
Figure:
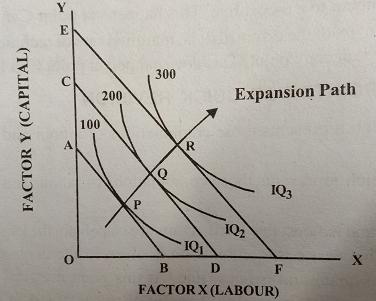
Here, it may be noted that the expansion path as shown in above figure is based on the assumption that the prices of two factors remain constant. Means, if the price of any one factor changes or if both the prices change, in different proportions, the expansion path too will change. Hence, the shape of the expansion path is not always necessarily as shown in above figure.
Sameway, if the iso-quants are more or less convex than what they shown in above figure, the tangency points will change and the expansion path also will change. Here the shapes of iso-quants depend on the degree of substitutability between the two factors.
CONTINUE READING
What is Expansion Path?
It shows path on which rational producer would prefer to increase scale of production of firm
Prices of two factors remain constant
Expansion Path
Kinnari
Tech writer at NewsandStory